This post is intended for those who have never generated any graphics using CODESYS.
CODESYS has a built in fully integrated visualization system.
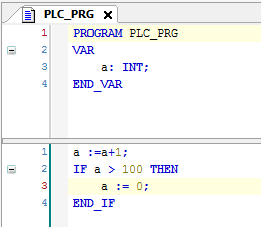
I have started by creating a very simple new CODESYS program using ST as the programming language.
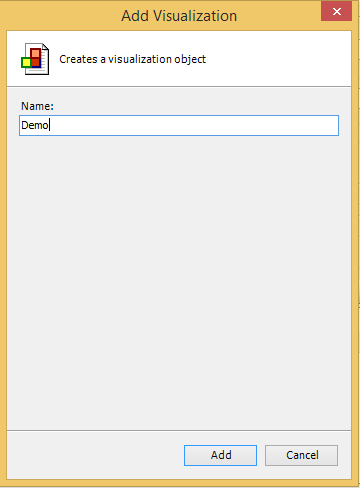
Next step is to add a blank visualization as shown below
I name the new visualization Demo.
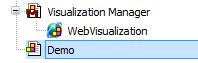
Adding the Demo visualisation object actually causes three objects to be added to the application.
Before progressing to actually create the visualisation, let’s have a quick look at each of these objects.
Visualization Manager
The Visualization Manager holds global settings such as the initial language, User Management, Hot Keys and language specific fonts. The Visualisation Manager provides a home to add visualization devices underneath. CODEYS supports a number of different visualization device types, the Raspberry Pi adaptation of CODESYS only supports WebVisualization and CODESYS HMI, we will only concern ourselves with WebVisualization in this post.
Web Visualization
The WebVisualization object adds a web server to the application. It also specifies which Visualisation to show when a browser first connects to a specified URL. The defaults are shown below.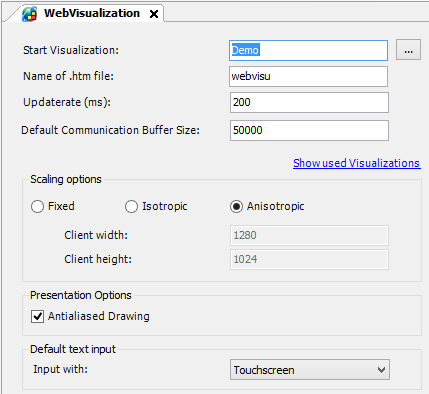
Scaling Options are to do with how the visualisation is changed if the size of the window showing them changes. I personally find that the visualisations look best with a Fixed scaling. As I will be testing the visualisations using computers with keyboards and not touchscreen I also change the Default test input to Keyboard.
NOTE: It is possible to have multiple Web Visualization objects each with distinct URLs that can be mapped to different Visualizations. It is equally possible to have multiple Visualizations and access them all through a single URL.
Vizualisation (Demo)
In simplistic terms this object represents a ‘Page’ on which we can add Visualization Elements. These Elements can range from simple lines and rectangles to complex objects such as gauges, alarm tables etc. Visualizations can also be embedded in a Frame element on another Visualisation, or even used to define custom keyboards or dialogs.
Demo Visualization
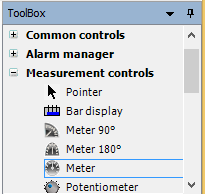
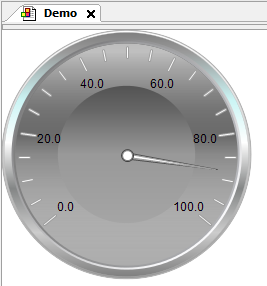
To create our simple application we will add a Meter to out Demo Visualization and get it to indicate the value of the VAR a in the simple program. Double click on the Demo object in the Devices tree to open up the Visualization. Find the Meter Element under Measurement Controls in the Toolbox.
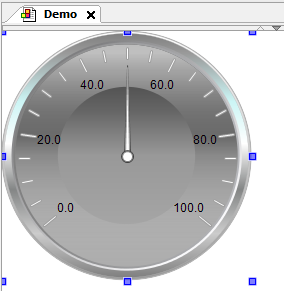
Then Left Click and drag a Meter from the Toolbox onto the top left of the Visualisation area.
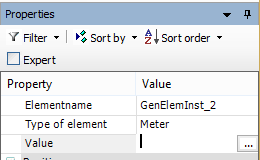
At tis point we have a Visualisation including a Meter element, but it is not associated with any variable in our application, so next we must associate a variable from the program with the Meter. In the Properties box with the Meter still selected click in the Value column against the Value Property, click again and then click the ellipsis.
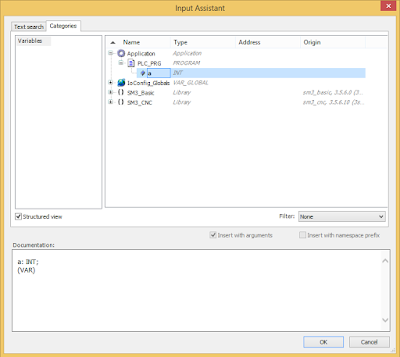
This will bring up the Input Assistant, select Application->PLC_PRG->a and click OK.
That’s it, we should now be able to go online and verify that our application runs and the visualisation is working. So select Online->Login from the main CODESYS menu, and Login with download. At this pint the Demo Visualization shows as message stating The online visualization is waiting for a connection. Please start the application. Start the application running (Debug->Start, or F5) and the Meter should start to move rapidly.
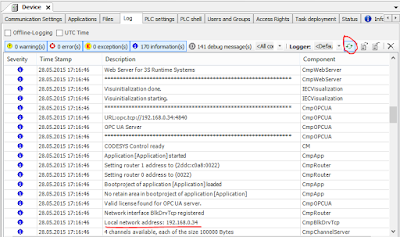
We should also be able to see the same in a web browser. To do this you need to know the IP address of the Raspberry Pi that you are using. If you can see the console it may have a message that stays something like My IP address is 192.168.0.34, or in CODESYS open the Device object, open the log tab, click the refresh button (shown below), scroll down through the log messages and the IP address will be shown.
or on the Raspberry Pi console type ifconfig, the ip address is shown as inet addr:
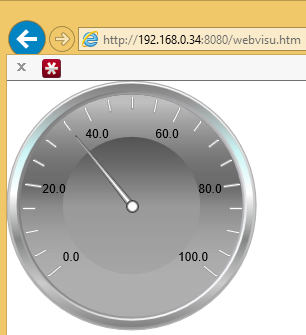
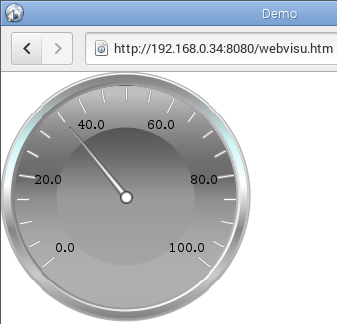
The URL to access the Web Visualisation is http://192.168.0.34:8080/webvisu.htm, the captures below show how the meter looks in Internet Explorer and on the browser on the Raspberry Pi.


Nice